
Boosting Cybersecurity with eBPF in Linux
![]()
Deep within the core of the Linux operating system, we find a remarkable tool known as eBPF, or Extended Berkeley Packet Filter. Beyond its initial role as a network packet filter, eBPF has evolved into a versatile framework that allows for the execution of customized programs within the Linux kernel.
Here’s a simplified ASCII representation of the eBPF architecture:
    +-----------------------+
    |    User-Space Apps    |
    +-----------------------+
             | | |
             | | |
             | | |
    +-----------------------+
    |        eBPF Maps       |
    +-----------------------+
             | | |
             | | |
             | | |
    +-----------------------+
    |        eBPF Loader     |
    +-----------------------+
             | | |
             | | |
             | | |
    +-----------------------+
    |   Verifier (Safety)   |
    +-----------------------+
             | | |
             | | |
             | | |
    +-----------------------+
    |   eBPF JIT Compiler    |
    +-----------------------+
             | | |
             | | |
             | | |
    +-----------------------+
    |       Hook Points      |
    +-----------------------+
             | | |
             | | |
             | | |
    +-----------------------+
    |       Kernel Space     |
    +-----------------------+
- User-space apps: These are the applications that use eBPF to extend the functionality of the kernel.
- eBPF maps: These are data structures that are used to store data by eBPF programs.
- eBPF loader: This is the component that loads eBPF programs into the kernel.
- Verifier (Safety): This is the component that verifies the safety of eBPF programs before they are loaded into the kernel.
- eBPF JIT compiler: This is the component that compiles eBPF programs into machine code that can be executed by the kernel.
- Hook points: These are the points in the kernel where eBPF programs can be inserted.
- Kernel space: This is the part of the operating system that runs in the kernel.
Let’s dive into the technical details of eBPF:
-
Kernel Interaction through Programs: eBPF enables the creation of programs, often written in languages like C or Rust. These programs are transformed into bytecode and executed within a secure virtual machine (BPF VM) residing within the kernel. This architecture grants users the ability to dynamically influence kernel behavior.
-
Secure Execution Environment: eBPF ensures secure execution by enforcing strict security measures. Programs run within a controlled environment to prevent system crashes and unauthorized access to kernel resources.
-
Data Management with Maps: eBPF programs frequently employ data structures referred to as “maps” to facilitate efficient data sharing between the user and kernel spaces. These maps come in various forms, such as hash maps and arrays, offering versatile data management capabilities.
-
Kernel Attach Points: eBPF programs attach to specific “hooks” within the kernel, enabling them to intercept and manipulate various system events and data flows. These attachment points can include network hooks, tracepoints, and more.
-
Real-Time Observability and Tracing: eBPF excels in providing real-time observability and tracing capabilities. It allows users to inspect kernel functions, system calls, and user-space applications as they execute, making it a valuable tool for debugging and performance analysis.
-
Ongoing Evolution: eBPF is a continuously evolving technology, with new features and enhancements introduced in different Linux kernel releases. This adaptability ensures that it remains at the forefront of technological innovation, addressing the evolving needs of the Linux ecosystem.
In the realm of cybersecurity, eBPF emerges as a vigilant guardian, continuously safeguarding systems against threats, including malicious applications and privilege escalation attempts. Here’s a closer examination of eBPF’s role in this context:
-
Identification of Malicious Behavior: eBPF functions as a cybersecurity sentinel, leveraging pattern recognition to identify suspicious behavior exhibited by running applications. It establishes baselines for normal operation and raises alarms when anomalies are detected.
-
Continuous Monitoring and Analysis: eBPF maintains persistent vigilance, scrutinizing the activities of running programs in real-time. Its capability to detect and analyze unusual actions ensures immediate threat detection and response.
-
Prevention of Privilege Escalation: Privilege escalation attempts are a prime target for malicious actors. eBPF excels at detecting and blocking these efforts, ensuring that unauthorized elevation of privileges is effectively mitigated.
-
Data Protection Mechanisms: eBPF takes an active role in safeguarding sensitive data. It prevents unauthorized access or manipulation of data by applications that may attempt to do so without proper authorization.
-
Tailored Security Solutions: eBPF’s adaptability allows for customized security configurations to meet specific requirements. It offers fine-grained control to adapt to emerging threats and evolving cybersecurity landscapes.
eBPF (Extended Berkeley Packet Filter) code can be crafted using various programming languages, including C, C++, Rust, Golang, Python, and bpftrace.
Now, let’s dive into bpftrace. What exactly is it?
bpftrace stands as a high-level tracing language tailored for eBPF on the Linux platform. It takes the form of a command-line tool that empowers users to create and execute eBPF programs.
The beauty of bpftrace lies in its simplicity. Its programming language closely resembles C, making it accessible for those with C programming experience. With bpftrace, you can trace and monitor various aspects of system behavior, including kernel functions, system calls, and network traffic.
bpftrace installation is as simple as running sudo apt install bpftrace
bpftrace offers the capability to trace a wide array of system events, encompassing:
1- Kernel Functions: bpftrace enables the tracing of kernel function executions. This proves invaluable for diagnosing performance bottlenecks or uncovering security vulnerabilities.
2- System Calls: With bpftrace, you can trace the execution of system calls. This serves as a powerful tool for debugging user-space applications and keeping a close eye on system behavior.
3- Network Packets: bpftrace empowers the tracing of network packets, a vital function for detecting suspicious activities and monitoring network traffic.
4- File System Operations: Tracing file system operations becomes effortless with bpftrace. This feature aids in diagnosing file system issues and observing file access patterns.
5- Process Events: bpftrace facilitates the tracing of process-related events, including process creation and termination. This capability proves beneficial for monitoring system activity and troubleshooting process-related problems.
5- Device Events: Device-related events, such as device opens and closes, can be effectively traced using bpftrace. This is particularly useful for debugging device-related issues and monitoring device usage patterns.
The availability of specific traceable events depends on the kernel version and enabled features. Among the most commonly used probes with bpftrace are:
kprobe: Triggered when a kernel function is called.
uprobe: Triggered when a user-space function is called.
tracepoint: Activated when particular kernel events, like system calls or file system operations occur.
usdt: Triggered when a specific userspace function is called.
rawtracepoints: Triggered when a specific event occurs in the kernel, but they do not provide any arguments.
hardware events: Triggered when a specific hardware event occurs, such as an interrupt or a timer tick.
profile: Profile probes are triggered at regular intervals, such as every millisecond or every second.
List of the most commonly used variables in boftrace:
pid: The process ID of the current process.
tid: The thread ID of the current thread.
uid: The user ID of the current process.
username: The username of the current process.
comm: The command name of the current process.
curtask: The current task_struct as a u64.
nsecs: The current time in nanoseconds.
elapsed: Time in nanoseconds since bpftrace start.
kstack: Kernel stack trace.
ustack: User-level stack trace.
arg0…argN: Function arguments.
List of the most commonly used functions in boftrace:
count(): Count the number of events.
sum(): Sum the values of a set of events.
avg(): Calculate the average of a set of events.
min(): Find the minimum value of a set of events.
max(): Find the maximum value of a set of events.
stats(): Calculate the statistical summary of a set of events.
hist(): Create a histogram of a set of events.
lhist(): Create a linear histogram of a set of events.
print(): Print the contents of a map.
printf(): Print formatted output.
time(): Print the current time.
join(): Join two strings.
str(): Convert a value to a string.
ksym(): Resolve a kernel symbol name.
usym(): Resolve a user-space symbol name.
kaddr(): Resolve a kernel address.
uaddr(): Resolve a user-space address.
reg(): Read a register value.
system(): Execute a system command.
exit(): Exit the bpftrace program.
To list all probes sudo bpftrace -l | more
Now, let’s explore the specifics of some eBPF probes and illustrate how to utilize them with bpftrace.
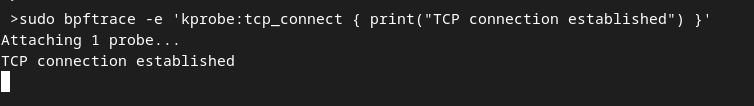
A kprobe in bpftrace is a kernel function probe that is triggered when a specific kernel function is executed. For example, kprobe:tcp_connect kprobe is a kernel function probe that is triggered when the tcp_connect() kernel function is executed.
sudo bpftrace -e 'kprobe:tcp_connect { print("TCP connection established") }'
open another terminal and execute something like telnet 1.1.1.1 80
An uprobe in bpftrace is a user-space function probe that is triggered when a specific user-space function is executed. For example, uprobe:/bin/bash:shell_execve uprobe is a user-space function probe that is triggered when the shell_execve() function in the /bin/bash binary is executed.
sudo bpftrace -e 'uprobe:/bin/bash:shell_execve { printf("execve called by /bin/bash with command: %s\n", str(arg0)); }'
open another terminal and execute something like ls

A tracepoint in bpftrace is a point in the kernel where a program can be inserted to monitor or modify the execution of the kernel. For example, tracepoint:syscalls:sys_enter_mkdir tracepoint is a kernel tracepoint that is triggered when the mkdir() system call is entered.
sudo bpftrace -e 'tracepoint:syscalls:sys_enter_mkdir { printf("mkdir called for directory: %s\n", str(args->pathname)); }' open another terminal and execute something like mkdir /tmp/test

Privilege escalation is a security vulnerability that allows an attacker to gain unauthorized access to a system. One common technique for privilege escalation is called fork-setuid-execve or clone-setuid-execve.
Privilege escalation through the combination of the fork, setuid, and execve system calls is a common and critical security concern in Linux environments. This attack vector typically begins with an attacker running a malicious program under their own low-privileged user account. The attacker leverages the fork or clone system call to create a child process, maintaining the same low privileges initially. However, they then use setuid to elevate their privileges within the child process. Finally, the attacker utilizes the exe`cve system call to replace the child process’s code with a potentially malicious binary running with escalated privileges.
It’s now possible with eBPF to monitor all running processes and track these calls. Deviations from expected patterns, such as an unauthorized fork then setuid call followed by an execve with a suspicious binary, can trigger alerts or prevent the escalation, safeguarding the system from unauthorized privilege elevation attempts.
Let’s start with the detection code with eBPF
#!/usr/bin/env bpftrace

BEGIN
{
    printf("Detecting privilege escalation: fork, setuid(0), execve\n");
}

tracepoint:syscalls:sys_enter_fork
{
    @forks[pid] = 1;
    printf("Fork detected: PID %d\n", pid);
}

tracepoint:syscalls:sys_enter_setuid
{
    if (uid == 0)
    {
        @setuid[pid] = 1;
        printf("Setuid detected: PID %d\n", pid);
    }
}

tracepoint:syscalls:sys_enter_execve
{
    if (@forks[pid] == 1 && @setuid[pid] == 1)
    {
        printf("Privilege escalation detected: fork, setuid(0), execve, PID %d\n", pid);
    }
}
The provided eBPFtrace script is a good starting point for detecting privilege escalation attempts involving the fork, setuid, and execve system calls. Here’s a breakdown of the script:
-
It sets up three tracepoints for the fork,
setuid, and execve system calls. When these system calls are invoked, the associated tracepoint blocks are triggered. -
In the
tracepoint:syscalls:sys_enter_forkblock, the script records the occurrence of aforksystem call by maintaining a map (@forks) where the key is the process ID (pid). This allows tracking of processes that have performed a fork. -
In the
tracepoint:syscalls:sys_enter_setuidblock, the script checks if the user ID (uid) being set is 0 (indicating an attempt to escalate privileges to root). If the condition is met, it records the event in another map (@setuid) using the process ID as the key. -
In the
tracepoint:syscalls:sys_enter_execveblock, the script checks if both a fork and asetuidevent have been previously recorded for the same process (i.e., the process is attempting privilege escalation). If so, it prints a message indicating the detection of privilege escalation with the process ID.
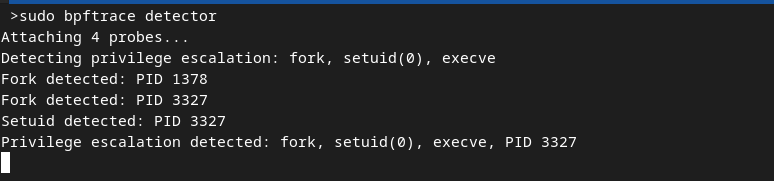
This script effectively monitors these critical system calls and identifies potential privilege escalation attempts when the specified conditions are met.
To use this script, make sure you have the bpftrace tool installed and run it with sudo permissions.
sudo bpftrace detector
The following assembly code serves as a demonstration of the sequence of system calls and actions required to simulate privilege escalation using fork-setuid-execve, which can potentially be detected using eBPF tracing as previously discussed.
section .data
  cmd db "/bin/bash", 0

section .text
  global _start

_start:
  ; Fork syscall
  mov eax, 57
  xor edi, edi
  syscall

  test eax, eax
  jz child_process

  ; Parent process

  ; Setuid syscall
  mov eax, 105
  xor edi, edi
  syscall

  cmp eax, 0
  jne exit_program

  ; Execve syscall
  mov eax, 59
  mov rdi, cmd
  xor rsi, rsi
  xor rdx, rdx
  syscall

exit_program:
  mov eax, 60
  xor edi, edi
  syscall

child_process:
  ; Child process
  xor eax, eax
  ret
The assembly code you provided creates a new process and executes the /bin/bash command in that process.
-
The first section of the code,
section .data, declares a constant string calledcmd. This string contains the path to the/bin/bashcommand. -
The second section,
section .text, contains the main function, called_start. This function first calls thefork()syscall to create a new process. Thefork()syscall returns the process ID of the new process in the parent process, and 0 in the child process. -
The test instruction in the
fork()syscall checks if the return value is 0. If it is, the code branches to thechild_processlabel, which is the code for the child process. Otherwise, the code continues to the next instruction, which is thesetuid()syscall. -
The
setuid()syscall changes the effective user ID of the process. This means that the process will be able to run commands with the privileges of the user who owns the/bin/bashcommand. -
The
cmpinstruction compares the return value of thesetuid()syscall to 0. If the return value is not 0, the code branches to theexit_programlabel, which terminates the process. Otherwise, the code continues to the next instruction, which is theexecve()syscall. -
The
execve()syscall executes the command specified by the cmd string. This means that the/bin/bashcommand will be executed in the child process. -
The
exit_programlabel contains the code for terminating the process. Themovinstruction sets theeaxregister to the value 60, which is theexitsyscall number. The xor instruction clears the edi register, which is theexitstatus. The syscall instruction executes theexitsyscall. -
The
child_processlabel contains the code for the child process. Thexorinstruction clears theeaxregister, which is the return value of the child process. Theretinstruction returns from the_startfunction.
For the sake of ease of execution, we’ll run this assembly code with root privileges, allowing us to simulate a scenario of privilege escalation by employing the fork-setuid-execve sequence.
First we compile it and link it.
nasm -f elf64 -o privilege_escalation.o privilege_escalation.asm
ld -o privilege_escalation privilege_escalation.o
Once the execution of privilege_escalation binary is started we should have Privilege escalation detected message
Detecting rootkits with eBPF becomes particularly valuable when dealing with well-known rootkits that are associated with specific kernel module names, such as the case of Diamorphine known as the diamorphine kernel module.
We will set up a scenario to detect specific types of rootkits that are known to be associated with recognizable kernel module names. To do this, we will create a dummy kernel module with a predetermined name and utilize bpftrace to actively identify any suspicious kernel modules that match this predefined name.
First, let’s start the bpftrace using sudo bpftrace -e 'tracepoint:module:module_load /str(args->name) == "suspicious_module"/ { printf("Suspicious kernel module loaded: %s\n", str(args->name)); }'. bpftrace command is designed to monitor the loading of a kernel module with the name “suspicious_module” and print a message if such a module is loaded.
Second, let’s build a kernel module:
- Create a new directory
mkdir rootkitthen access the new directorycd rootkit. - Create a new file
suspicious_module.cwith the following:
#include <linux/module.h>
MODULE_LICENSE("GPL");


int init_module(void) {
    printk(KERN_INFO "Suspicious module loaded\n");
    return 0;
}

void cleanup_module(void) {
    printk(KERN_INFO "Suspicious module unloaded\n");
}
- Create
Makefilewith the following:
obj-m := suspicious_module.o

all:
	make -C /lib/modules/$(shell uname -r)/build M=$(PWD) modules

clean:
	make -C /lib/modules/$(shell uname -r)/build M=$(PWD) clean
- Install Linux-Headers
sudo apt-get install build-essential linux-headers-$(uname -r) - Load the kernel module
sudo insmod suspicious_module.ko
bpftrace command will print Suspicious kernel module loaded

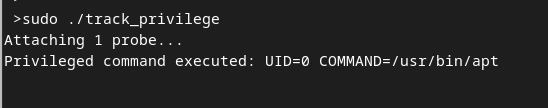
The technique of detecting privileged command executions with BPFtrace is a powerful means of enhancing system security and auditing capabilities in Linux environments. By leveraging BPFtrace’s tracing capabilities and the tracepoint:syscalls:sys_enter_execve tracepoint, this code can intercept and scrutinize execve system calls, which are at the core of command execution in Unix-based systems. The code enforces strict criteria to identify and log instances where commands like sudo or su are executed by users holding superuser privileges, typically the root user. This functionality provides a proactive security layer by alerting system administrators to potentially sensitive actions in real-time. The code not only enhances threat detection but also facilitates incident response and forensic analysis, enabling administrators to swiftly address security breaches or unauthorized activities. With its non-intrusive nature and robust tracing capabilities, this approach stands as a valuable asset in safeguarding system integrity and preserving a secure computing environment.
#!/usr/bin/env bpftrace

tracepoint:syscalls:sys_enter_execve /uid == 0 && (comm == "sudo" || comm == "su")/ {
    printf("Privileged command executed: UID=%d COMMAND=%s\n", uid, str(args->filename));
}
Then by executing any sudo command such as sudo apt update
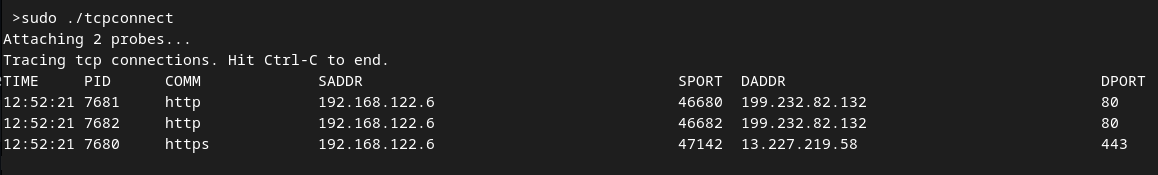
Tracing TCP connections with BPFtrace presents a robust approach to real-time network monitoring in Linux environments. This script, developed by iovisor, leverages BPFtrace’s dynamic tracing capabilities to capture vital details about TCP connections, such as the process initiating the connection, source and destination IP addresses, as well as ports involved in the communication. By attaching a kprobe to the tcp_connect function, it tracks new connections as they are established, allowing for instantaneous visibility into network activity. The script’s ability to handle both IPv4 and IPv6 connections enhances its versatility.
https://github.com/iovisor/bpftrace/blob/master/tools/tcpconnect.bt
#!/usr/bin/env bpftrace

#ifndef BPFTRACE_HAVE_BTF
#include <linux/socket.h>
#include <net/sock.h>
#else
#include <sys/socket.h>
#endif

BEGIN
{
  printf("Tracing tcp connections. Hit Ctrl-C to end.\n");
  printf("%-8s %-8s %-16s ", "TIME", "PID", "COMM");
  printf("%-39s %-6s %-39s %-6s\n", "SADDR", "SPORT", "DADDR", "DPORT");
}

kprobe:tcp_connect
{
  $sk = ((struct sock *) arg0);
  $inet_family = $sk->__sk_common.skc_family;

  if ($inet_family == AF_INET || $inet_family == AF_INET6) {
    if ($inet_family == AF_INET) {
      $daddr = ntop($sk->__sk_common.skc_daddr);
      $saddr = ntop($sk->__sk_common.skc_rcv_saddr);
    } else {
      $daddr = ntop($sk->__sk_common.skc_v6_daddr.in6_u.u6_addr8);
      $saddr = ntop($sk->__sk_common.skc_v6_rcv_saddr.in6_u.u6_addr8);
    }
    $lport = $sk->__sk_common.skc_num;
    $dport = $sk->__sk_common.skc_dport;

    // Destination port is big endian, it must be flipped
    $dport = bswap($dport);

    time("%H:%M:%S ");
    printf("%-8d %-16s ", pid, comm);
    printf("%-39s %-6d %-39s %-6d\n", $saddr, $lport, $daddr, $dport);
  }
}
Here’s a breakdown of the script’s functionality:
-
The script begins by printing an informative message indicating that it is tracing TCP connections.
-
It sets up the format for the output by defining column headers for each field: TIME, PID, COMM, SADDR, SPORT, DADDR, and DPORT.
-
The script attaches a
kprobeto thetcp_connectfunction, which is called when a TCP connection is established. This allows the script to capture information about new TCP connections. -
Inside the kprobe, it extracts various details about the connection, including the socket structure, address family, source and destination addresses (both IPv4 and IPv6 are supported), source and destination ports, and protocol information.
-
The script then formats and prints this information in a tabular format, with each field properly aligned for clarity.
In conclusion,This powerful technology has proven to be a game-changer by providing real-time visibility, control, and security at the kernel level. eBPF’s ability to inspect and filter network traffic, trace system calls, and monitor application behavior has given security professionals the tools they need to proactively identify and mitigate vulnerabilities. Its low overhead and minimal impact on system performance make it an attractive option for organizations seeking to boost their cybersecurity defenses without compromising on operational efficiency. Personally, I strongly believe that eBPF is going to change the landscape of cybersecurity.